Understanding Web Mercator, tiles, pixels, and map math by implementing your own OSM renderer in pure JavaScript.
Introduction
Most developers use libraries like Leaflet, OpenLayers, or Mapbox GL to render maps. These libraries hide a huge amount of mathematics and geodesy behind a simple API.
But what actually happens when you:
- Convert latitude/longitude to pixels?
- Zoom in and out?
- Drag the map?
- See Greenland looking bigger than Africa?
In this article, we will build a minimal OpenStreetMap (OSM) renderer from scratch using HTML Canvas and JavaScript, and along the way understand:
- Web Mercator Projection (EPSG:3857)
- Tile pyramids
- World coordinates vs pixels
- Why the poles “explode”
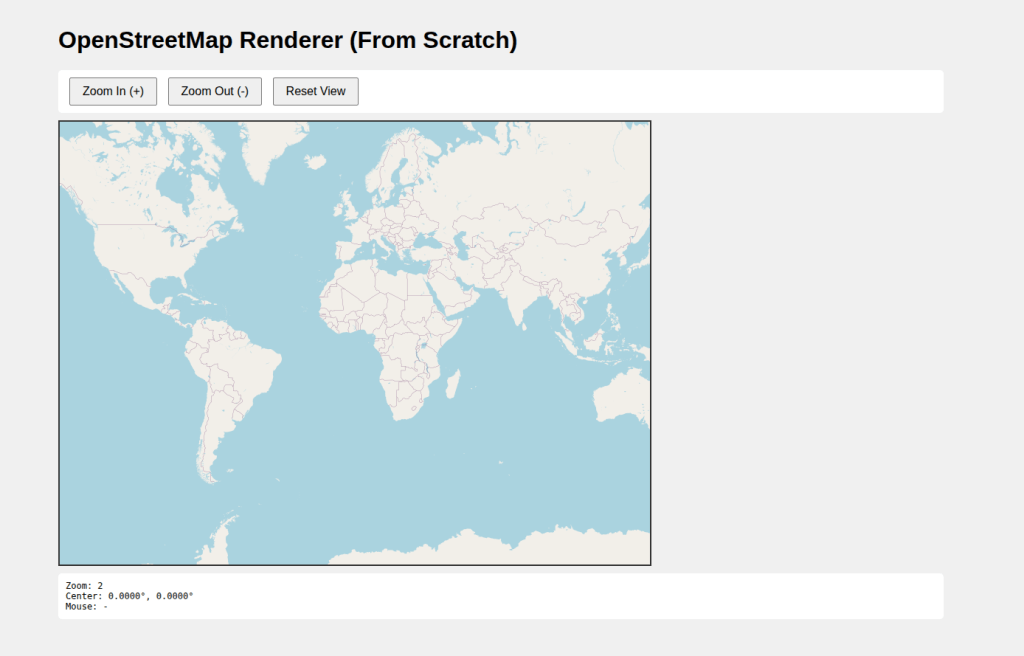
This post is based on the complete working code shown below.
Full Source Code
|
1 2 3 4 5 6 7 8 9 10 11 12 13 14 15 16 17 18 19 20 21 22 23 24 25 26 27 28 29 30 31 32 33 34 35 36 37 38 39 40 41 42 43 44 45 46 47 48 49 50 51 52 53 54 55 56 57 58 59 60 61 62 63 64 65 66 67 68 69 70 71 72 73 74 75 76 77 78 79 80 81 82 83 84 85 86 87 88 89 90 91 92 93 94 95 96 97 98 99 100 101 102 103 104 105 106 107 108 109 110 111 112 113 114 115 116 117 118 119 120 121 122 123 124 125 126 127 128 129 130 131 132 133 134 135 136 137 138 139 140 141 142 143 144 145 146 147 148 149 150 151 152 153 154 155 156 157 158 159 160 161 162 163 164 165 166 167 168 169 170 171 172 173 174 175 176 177 178 179 180 181 182 183 184 185 186 187 188 189 190 191 192 193 194 195 196 197 198 199 200 201 202 203 204 205 206 207 208 209 210 211 212 213 214 215 216 217 218 219 220 221 222 223 224 225 226 227 228 229 230 231 232 233 234 235 236 237 238 239 240 241 242 243 244 245 246 247 248 249 250 251 252 253 254 255 256 257 258 259 260 261 262 263 264 265 266 267 268 269 270 271 272 273 274 275 276 277 278 279 280 281 282 283 284 285 286 287 288 289 290 291 292 293 294 295 296 297 298 299 300 301 302 303 304 305 306 307 308 309 310 311 312 313 314 315 316 317 318 319 320 321 322 323 324 325 326 327 328 329 330 331 332 333 334 335 336 337 338 339 340 341 342 343 344 345 346 347 348 349 350 351 352 353 354 355 356 357 358 359 360 361 362 363 364 365 366 367 368 369 370 371 372 373 374 375 376 377 378 379 380 381 382 383 384 385 386 387 388 389 390 |
<!DOCTYPE html> <html lang="en"> <head> <meta charset="UTF-8"> <meta name="viewport" content="width=device-width, initial-scale=1.0"> <title>OSM Map Renderer</title> <style> body { margin: 0; padding: 20px; font-family: Arial, sans-serif; background: #f0f0f0; } #container { max-width: 1200px; margin: 0 auto; } #map { border: 2px solid #333; cursor: move; background: #aad3df; display: block; } .controls { margin: 10px 0; padding: 10px; background: white; border-radius: 5px; } button { padding: 8px 16px; margin: 0 5px; cursor: pointer; font-size: 16px; } .info { margin-top: 10px; padding: 10px; background: white; border-radius: 5px; font-family: monospace; font-size: 12px; } </style> </head> <body> <div id="container"> <h1>OpenStreetMap Renderer (From Scratch)</h1> <div class="controls"> <button id="zoomIn">Zoom In (+)</button> <button id="zoomOut">Zoom Out (-)</button> <button id="reset">Reset View</button> </div> <canvas id="map" width="800" height="600"></canvas> <div class="info"> <div>Zoom: <span id="zoomLevel">2</span></div> <div>Center: <span id="centerCoords">0°, 0°</span></div> <div>Mouse: <span id="mouseCoords">-</span></div> </div> </div> <script> // ============================================ // MATHEMATICAL FOUNDATIONS // ============================================ // Web Mercator Projection (EPSG:3857) // This converts latitude/longitude to x/y coordinates // The math behind it: const TILE_SIZE = 256; // Standard OSM tile size const MAX_LATITUDE = 85.0511287798; // Web Mercator limit // Mercator Projection Functions // Convert latitude/longitude (in degrees) to world coordinates (0-256 at zoom 0) function latLonToWorld(lat, lon, zoom) { // Clamp latitude to Web Mercator bounds lat = Math.max(Math.min(lat, MAX_LATITUDE), -MAX_LATITUDE); // Convert degrees to radians const latRad = lat * Math.PI / 180; const lonRad = lon * Math.PI / 180; // Mercator projection formulas: // x = R * λ (where λ is longitude in radians) // y = R * ln(tan(π/4 + φ/2)) (where φ is latitude in radians) // Normalize to 0-1 range: const x = (lon + 180) / 360; // The y formula uses the Gudermannian function // This projects the sphere onto a cylinder const sinLat = Math.sin(latRad); const y = 0.5 - Math.log((1 + sinLat) / (1 - sinLat)) / (4 * Math.PI); // Scale by 2^zoom to get pixel coordinates const scale = Math.pow(2, zoom); return { x: x * TILE_SIZE * scale, y: y * TILE_SIZE * scale }; } // Inverse Mercator projection // Convert world coordinates back to latitude/longitude function worldToLatLon(x, y, zoom) { const scale = Math.pow(2, zoom); const worldX = x / (TILE_SIZE * scale); const worldY = y / (TILE_SIZE * scale); // Inverse formulas: const lon = worldX * 360 - 180; // Inverse Gudermannian function const n = Math.PI - 2 * Math.PI * worldY; const lat = (180 / Math.PI) * Math.atan(0.5 * (Math.exp(n) - Math.exp(-n))); return { lat, lon }; } // Convert world coordinates to tile coordinates // Each tile is 256x256 pixels function worldToTile(worldX, worldY) { return { tileX: Math.floor(worldX / TILE_SIZE), tileY: Math.floor(worldY / TILE_SIZE), offsetX: worldX % TILE_SIZE, offsetY: worldY % TILE_SIZE }; } // ============================================ // MAP RENDERER CLASS // ============================================ class OSMRenderer { constructor(canvas) { this.canvas = canvas; this.ctx = canvas.getContext('2d'); // View state this.zoom = 2; this.centerLat = 0; this.centerLon = 0; // Pan state this.isDragging = false; this.dragStartX = 0; this.dragStartY = 0; this.viewOffsetX = 0; this.viewOffsetY = 0; // Tile cache this.tileCache = new Map(); this.setupEventHandlers(); this.render(); } // Get visible tiles for current view getVisibleTiles() { const centerWorld = latLonToWorld(this.centerLat, this.centerLon, this.zoom); // Calculate the world coordinates of canvas corners const topLeftWorldX = centerWorld.x - this.canvas.width / 2 - this.viewOffsetX; const topLeftWorldY = centerWorld.y - this.canvas.height / 2 - this.viewOffsetY; const bottomRightWorldX = centerWorld.x + this.canvas.width / 2 - this.viewOffsetX; const bottomRightWorldY = centerWorld.y + this.canvas.height / 2 - this.viewOffsetY; // Convert to tile coordinates const topLeft = worldToTile(topLeftWorldX, topLeftWorldY); const bottomRight = worldToTile(bottomRightWorldX, bottomRightWorldY); // Calculate tiles needed const tiles = []; const maxTile = Math.pow(2, this.zoom) - 1; for (let tileY = topLeft.tileY; tileY <= bottomRight.tileY; tileY++) { for (let tileX = topLeft.tileX; tileX <= bottomRight.tileX; tileX++) { // Wrap X coordinates (longitude wraps around) let wrappedX = tileX; while (wrappedX < 0) wrappedX += maxTile + 1; while (wrappedX > maxTile) wrappedX -= maxTile + 1; // Clamp Y coordinates (latitude has bounds) if (tileY >= 0 && tileY <= maxTile) { tiles.push({ x: wrappedX, y: tileY, z: this.zoom }); } } } return tiles; } // Load a tile image loadTile(x, y, z) { const key = `${z}/${x}/${y}`; if (this.tileCache.has(key)) { return this.tileCache.get(key); } const img = new Image(); img.crossOrigin = 'anonymous'; // OSM tile server URL pattern // Format: https://tile.openstreetmap.org/{z}/{x}/{y}.png img.src = `https://tile.openstreetmap.org/${z}/${x}/${y}.png`; const tileData = { img, loaded: false }; this.tileCache.set(key, tileData); img.onload = () => { tileData.loaded = true; this.render(); }; return tileData; } // Main render function render() { // Clear canvas this.ctx.fillStyle = '#aad3df'; this.ctx.fillRect(0, 0, this.canvas.width, this.canvas.height); const centerWorld = latLonToWorld(this.centerLat, this.centerLon, this.zoom); const tiles = this.getVisibleTiles(); // Draw each tile tiles.forEach(tile => { const tileData = this.loadTile(tile.x, tile.y, tile.z); if (tileData.loaded) { // Calculate tile position on canvas // World coordinates of tile's top-left corner const tileWorldX = tile.x * TILE_SIZE; const tileWorldY = tile.y * TILE_SIZE; // Canvas position relative to center const canvasX = (tileWorldX - centerWorld.x) + this.canvas.width / 2 + this.viewOffsetX; const canvasY = (tileWorldY - centerWorld.y) + this.canvas.height / 2 + this.viewOffsetY; this.ctx.drawImage(tileData.img, canvasX, canvasY, TILE_SIZE, TILE_SIZE); } }); this.updateInfo(); } // Zoom in (doubles the scale) zoomIn() { if (this.zoom < 18) { this.zoom++; this.viewOffsetX = 0; this.viewOffsetY = 0; this.render(); } } // Zoom out (halves the scale) zoomOut() { if (this.zoom > 0) { this.zoom--; this.viewOffsetX = 0; this.viewOffsetY = 0; this.render(); } } // Reset to initial view reset() { this.zoom = 2; this.centerLat = 0; this.centerLon = 0; this.viewOffsetX = 0; this.viewOffsetY = 0; this.render(); } // Update info display updateInfo() { document.getElementById('zoomLevel').textContent = this.zoom; document.getElementById('centerCoords').textContent = `${this.centerLat.toFixed(4)}°, ${this.centerLon.toFixed(4)}°`; } // Event handlers setupEventHandlers() { // Mouse down - start dragging this.canvas.addEventListener('mousedown', (e) => { this.isDragging = true; this.dragStartX = e.clientX; this.dragStartY = e.clientY; this.canvas.style.cursor = 'grabbing'; }); // Mouse move - pan map this.canvas.addEventListener('mousemove', (e) => { if (this.isDragging) { const dx = e.clientX - this.dragStartX; const dy = e.clientY - this.dragStartY; this.viewOffsetX += dx; this.viewOffsetY += dy; this.dragStartX = e.clientX; this.dragStartY = e.clientY; this.render(); } // Update mouse coordinates const rect = this.canvas.getBoundingClientRect(); const canvasX = e.clientX - rect.left; const canvasY = e.clientY - rect.top; const centerWorld = latLonToWorld(this.centerLat, this.centerLon, this.zoom); const worldX = centerWorld.x + (canvasX - this.canvas.width / 2) - this.viewOffsetX; const worldY = centerWorld.y + (canvasY - this.canvas.height / 2) - this.viewOffsetY; const coords = worldToLatLon(worldX, worldY, this.zoom); document.getElementById('mouseCoords').textContent = `${coords.lat.toFixed(4)}°, ${coords.lon.toFixed(4)}°`; }); // Mouse up - stop dragging, update center this.canvas.addEventListener('mouseup', () => { if (this.isDragging) { // Update center based on pan offset const centerWorld = latLonToWorld(this.centerLat, this.centerLon, this.zoom); const newWorldX = centerWorld.x - this.viewOffsetX; const newWorldY = centerWorld.y - this.viewOffsetY; const newCenter = worldToLatLon(newWorldX, newWorldY, this.zoom); this.centerLat = newCenter.lat; this.centerLon = newCenter.lon; this.viewOffsetX = 0; this.viewOffsetY = 0; } this.isDragging = false; this.canvas.style.cursor = 'move'; }); // Mouse leave this.canvas.addEventListener('mouseleave', () => { this.isDragging = false; this.canvas.style.cursor = 'move'; }); // Zoom with mouse wheel this.canvas.addEventListener('wheel', (e) => { e.preventDefault(); if (e.deltaY < 0) { this.zoomIn(); } else { this.zoomOut(); } }); } } // ============================================ // INITIALIZATION // ============================================ const canvas = document.getElementById('map'); const renderer = new OSMRenderer(canvas); // Button controls document.getElementById('zoomIn').addEventListener('click', () => renderer.zoomIn()); document.getElementById('zoomOut').addEventListener('click', () => renderer.zoomOut()); document.getElementById('reset').addEventListener('click', () => renderer.reset()); // Keyboard controls document.addEventListener('keydown', (e) => { if (e.key === '+' || e.key === '=') renderer.zoomIn(); if (e.key === '-' || e.key === '_') renderer.zoomOut(); }); </script> </body> </html> |
Why OpenStreetMap Tiles Work
OpenStreetMap tiles follow a simple rule:
- The world is projected using Web Mercator (EPSG:3857)
- The world is split into 256×256 pixel tiles
- At zoom level
z, the world has2^z × 2^ztiles
| Zoom | Tiles Across | World Size (px) |
|---|---|---|
| 0 | 1 | 256 × 256 |
| 1 | 2 | 512 × 512 |
| 2 | 4 | 1024 × 1024 |
| z | 2^z | 256 × 2^z |
Web Mercator Projection (EPSG:3857)
Latitude / Longitude Reality
- Longitude is linear (−180° → +180°)
- Latitude is not linear on a flat surface
To draw the Earth on a rectangle, OSM uses the Mercator projection, originally designed for navigation.
Mercator Math (The Core Formula)
Forward Projection
We convert latitude and longitude into world coordinates.
x = (lon + 180) / 360

y = 0.5 - ln((1 + sin(lat)) / (1 - sin(lat))) / (4π)
Key idea:
- Longitude maps linearly to X
- Latitude uses a logarithmic function
This is why:
tan(90°) → ∞
And therefore:
The poles can never be drawn
Why Latitude Is Limited to ±85.0511°
If latitude reached ±90°:
ln(tan(π/4 + φ/2)) → ∞
So Web Mercator clamps latitude to:
±85.0511287798°
This makes the projected world finite and tileable.
World Coordinates vs Pixels
At zoom 0:
World = 256 × 256 pixels
At zoom z:
World size = 256 × 2^z pixels
Latitude/Longitude → World Pixels → Tile Pixels
Tiles: The Map Pyramid
Each tile:
- Is 256×256 pixels
- Has an address:
{z}/{x}/{y}
Example:
https://tile.openstreetmap.org/4/8/6.png
Where:
z= zoomx= columny= row
Rendering Tiles on Canvas
Steps:
- Convert map center lat/lon → world pixels
- Compute visible world bounds
- Convert world bounds → tile range
- Load tiles
- Draw tiles at correct canvas position
This is exactly what mapping libraries do internally.
Panning (Dragging the Map)
Dragging does not immediately change latitude/longitude.
Instead:
- We shift the view using pixel offsets
- On mouse release, offsets are converted back to lat/lon
This makes panning smooth and precise.
Zooming
Zooming works by:
- Increasing or decreasing
z - Resetting offsets
- Recomputing tile coverage
Every zoom level doubles map resolution.
Mouse Coordinate Conversion
To show mouse lat/lon:
- Convert canvas pixel → world pixel
- Convert world pixel → lat/lon (inverse Mercator)
This is how GIS tools show coordinates under the cursor.
Why Greenland Looks Bigger Than Africa
Mercator preserves:
- Angles (good for navigation)
But distorts:
- Area (bad for size comparison)
At high latitudes:
- Scale factor increases dramatically
- Land appears stretched vertically
This is a mathematical consequence of:
scale = 1 / cos(latitude)
What You Just Built
With ~500 lines of JavaScript, you implemented:
- A Web Mercator projection engine
- A tile-based renderer
- Zoom and pan interaction
- Coordinate conversion
You now understand what powers Leaflet, OpenLayers, Mapbox, Google Maps, and almost every web map.
When NOT to Use Web Mercator
Avoid EPSG:3857 when:
- Accurate area matters
- Polar regions are important
- Scientific or climate analysis is required
Use equal-area or local projections instead.
Conclusion
Building a map renderer from scratch is the best way to truly understand GIS fundamentals.
Once you understand:
- Projections
- Tiles
- Pixels
- Zoom math
You stop treating maps as magic — and start treating them as geometry and math.
Happy mapping 🚀
I hope this tutorial will create a good foundation for you. If you want tutorials on another topic or you have any queries, please send an mail at contact@spatial-dev.guru.