


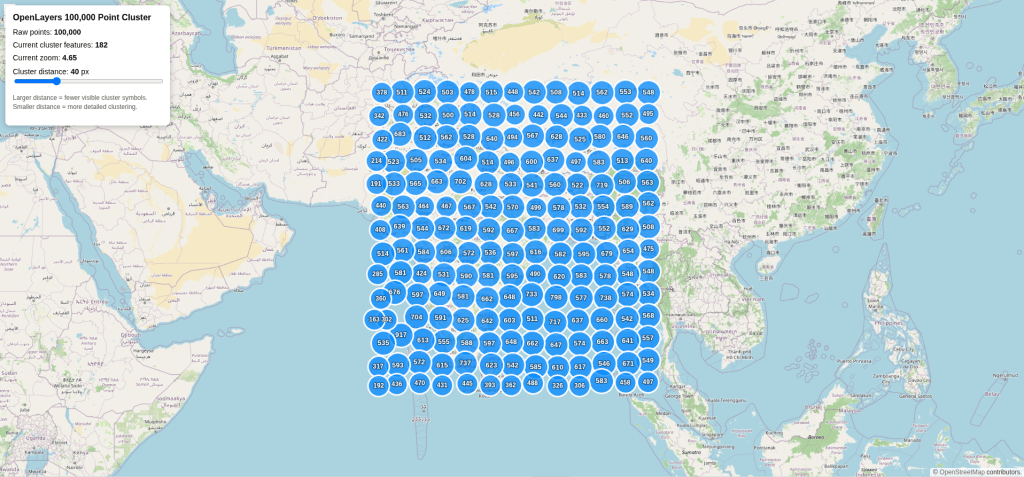
Rendering thousands of markers on a web map is one of the most common performance bottlenecks in GIS web development. If you’ve ever tried to plot 50,000 or 100,000 points on an OpenLayers map without clustering, you already know the result: a frozen browser tab, sluggish panning, and frustrated users.
In this tutorial, you’ll learn how to build a high-performance OpenLayers map that clusters 100,000 points smoothly with smart caching, an interactive distance slider, and click-to-zoom behavior. Everything runs client-side in a single HTML file — no build tools required.
Complete Source Code is available here.
What You’ll Build
By the end of this guide, you’ll have a working map that:
- Generates and renders 100,000 random points across India
- Groups nearby points into clusters that update as you zoom
- Lets users adjust the cluster distance with a live slider
- Zooms into a cluster’s bounding extent on click
- Stays responsive even on modest hardware
Why Clustering Matters for Performance
When you put 100,000 individual point features on a vector layer, the browser has to compute and paint every single one on every frame. Clustering solves this by grouping nearby features into a single representative symbol — at zoom level 5, a cluster of 5,000 points renders as just one circle with a label.
The trick is doing this correctly. Naive implementations create new style objects on every render, call addFeature() in a loop, and enable expensive update flags that defeat the purpose. We’ll avoid all of those traps.
If you want a deeper conceptual primer on OpenLayers clustering before diving in, check out this companion guide: Clustered Features in OpenLayers.
Step 1: Set Up the HTML and OpenLayers CDN
Create a new file called cluster-map.html. We’ll load OpenLayers from a CDN so you don’t need npm or a bundler.
<html lang="en"><head> <meta charset="UTF-8" /> <title>OpenLayers 100,000 Point Clustering</title> <link rel="stylesheet" href="https://cdn.jsdelivr.net/npm/ol@v10.9.0/ol.css" /> <script src="https://cdn.jsdelivr.net/npm/ol@v10.9.0/dist/ol.js"></script></head><body> <div id="map"></div> <!-- info panel goes here --> <script> // map logic goes here </script></body></html>
The ol.js full build exposes everything under the global ol namespace, which keeps the example readable.
Step 2: Add the Map Container and Info Panel
We need a full-screen map and a floating panel for stats and the distance slider. Add this CSS inside the <head>:
html, body { margin: 0; padding: 0; width: 100%; height: 100%; font-family: Arial, sans-serif;}#map { width: 100%; height: 100vh;}#infoPanel { position: absolute; top: 12px; left: 12px; z-index: 1000; background: white; padding: 14px; border-radius: 8px; box-shadow: 0 2px 12px rgba(0, 0, 0, 0.25); font-size: 14px; min-width: 280px;}input[type="range"] { width: 100%; }
Then drop in the panel markup inside <body> above the script:
<div id="infoPanel"> <h3>OpenLayers 100,000 Point Cluster</h3> <div>Raw points: <b id="rawCount">0</b></div> <div>Current cluster features: <b id="clusterCount">0</b></div> <div>Current zoom: <b id="zoomValue">0</b></div> <label> Cluster distance: <b id="distanceValue">40</b> px <input id="distanceSlider" type="range" min="10" max="120" value="40" /> </label></div>
Step 3: Generate 100,000 Features the Right Way
Here’s where the first major performance decision happens. Instead of creating a VectorSource and calling addFeature() 100,000 times — which triggers an internal update on every call — we build the entire feature array first and pass it to the source constructor in one shot.
const TOTAL_POINTS = 100000;const minLon = 68.0, maxLon = 98.0;const minLat = 6.0, maxLat = 36.0;function randomBetween(min, max) { return min + Math.random() * (max - min);}function createRandomFeatures(count) { const features = new Array(count); for (let i = 0; i < count; i++) { const lon = randomBetween(minLon, maxLon); const lat = randomBetween(minLat, maxLat); const coordinate3857 = ol.proj.fromLonLat([lon, lat]); features[i] = new ol.Feature({ geometry: new ol.geom.Point(coordinate3857), pointId: i }); } return features;}const pointFeatures = createRandomFeatures(TOTAL_POINTS);const pointSource = new ol.source.Vector({ features: pointFeatures });
Pre-allocating the array with new Array(count) and indexing into it is meaningfully faster than push() at this scale. Note that we project from EPSG:4326 (lon/lat) to EPSG:3857 (Web Mercator) once, at creation time — never inside a render callback.
In a real project, replace createRandomFeatures with a GeoJSON loader, a PostGIS API call, or a CSV parser. The key principle stays the same: build the array, then hand it to the source.
Step 4: Wrap the Source in a Cluster Source
OpenLayers ships with ol.source.Cluster, which wraps any vector source and exposes clustered features at the current zoom level.
const distanceSlider = document.getElementById("distanceSlider");const clusterSource = new ol.source.Cluster({ distance: Number(distanceSlider.value), minDistance: 10, source: pointSource});
Two parameters control the behavior. distance is the pixel radius within which points get grouped — larger values produce fewer, chunkier clusters. minDistance enforces a minimum pixel gap between resulting clusters so they don’t visually overlap.
Step 5: Cache Cluster Styles (The Most Important Optimization)
This is the optimization most tutorials skip, and it’s the single biggest win. The style function runs once per visible cluster on every render. If you allocate a new ol.style.Style object inside it, the garbage collector will thrash and your map will stutter during pan and zoom.
The fix is a style cache keyed by visual bucket:
const styleCache = {};

function getClusterStyle(clusterFeature) {
  const children = clusterFeature.get("features");
  const size = children.length;

  let radius, fontSize;
  if (size >= 1000)      { radius = 26; fontSize = 13; }
  else if (size >= 500)  { radius = 23; fontSize = 13; }
  else if (size >= 100)  { radius = 20; fontSize = 12; }
  else if (size >= 10)   { radius = 16; fontSize = 12; }
  else                    { radius = 10; fontSize = 11; }

  const cacheKey = ${radius}-${fontSize}-${size};

  if (!styleCache[cacheKey]) {
    styleCache[cacheKey] = new ol.style.Style({
      image: new ol.style.Circle({
        radius: radius,
        fill: new ol.style.Fill({ color: "rgba(0, 136, 255, 0.75)" }),
        stroke: new ol.style.Stroke({
          color: "rgba(255, 255, 255, 0.95)",
          width: 3
        })
      }),
      text: new ol.style.Text({
        text: size.toString(),
        font: bold ${fontSize}px Arial,
        fill: new ol.style.Fill({ color: "#ffffff" }),
        stroke: new ol.style.Stroke({
          color: "rgba(0, 0, 0, 0.45)",
          width: 3
        })
      })
    });
  }
  return styleCache[cacheKey];
}
Because most clusters share visual properties at a given zoom, the cache fills up quickly and subsequent renders just look up a pre-built style object.
Step 6: Build the Vector Layer with Sensible Update Flags
const clusterLayer = new ol.layer.Vector({ source: clusterSource, style: getClusterStyle, updateWhileAnimating: false, updateWhileInteracting: false});
The two updateWhile* flags default to false, but it’s worth setting them explicitly. Turning them on forces OpenLayers to re-batch features mid-animation, which is exactly what you don’t want for a 100,000-point dataset. Leave them off — the map will still re-cluster after pan/zoom finishes, which is fast enough to feel instant.
Step 7: Assemble the Map
const osmLayer = new ol.layer.Tile({ source: new ol.source.OSM() });const map = new ol.Map({ target: "map", layers: [osmLayer, clusterLayer], view: new ol.View({ center: ol.proj.fromLonLat([78.9629, 20.5937]), zoom: 5 })});
The center coordinates point to the geographic center of India at zoom level 5, which gives a nice overview of the random point distribution.
Step 8: Wire Up Live Stats and the Distance Slider
The info panel updates whenever the map moves or the cluster source changes:
const rawCountEl = document.getElementById("rawCount");const clusterCountEl = document.getElementById("clusterCount");const zoomValueEl = document.getElementById("zoomValue");const distanceValueEl = document.getElementById("distanceValue");rawCountEl.textContent = TOTAL_POINTS.toLocaleString();function updateStats() { zoomValueEl.textContent = map.getView().getZoom().toFixed(2); clusterCountEl.textContent = clusterSource.getFeatures().length.toLocaleString();}map.on("moveend", updateStats);clusterSource.on("change", updateStats);distanceSlider.addEventListener("input", function () { const distance = Number(distanceSlider.value); distanceValueEl.textContent = distance; clusterSource.setDistance(distance); updateStats();});updateStats();
setDistance() is the official API for changing the cluster radius at runtime — it triggers a re-cluster automatically.
Step 9: Click a Cluster to Zoom In
A good clustered map should let users drill down. We use clusterLayer.getFeatures(pixel) to detect what was clicked, then either log the single point or fit the view to the cluster’s bounding extent.
map.on("click", function (event) { clusterLayer.getFeatures(event.pixel).then(function (clickedFeatures) { if (!clickedFeatures.length) return; const clusterFeature = clickedFeatures[0]; const children = clusterFeature.get("features"); if (!children || children.length === 0) return; if (children.length === 1) { console.log("Single point clicked:", children[0].get("pointId")); return; } const coordinates = children.map(f => f.getGeometry().getCoordinates()); const extent = ol.extent.boundingExtent(coordinates); map.getView().fit(extent, { duration: 400, padding: [80, 80, 80, 80], maxZoom: 16 }); });});
The maxZoom: 16 cap prevents the view from snapping to street-level when a tight cluster is clicked, which keeps the experience predictable.
Save and Test
Save the file and open it directly in your browser — no server needed. You should see 100,000 points clustered across India, the panel showing live stats, and smooth panning at all zoom levels. Drag the slider to feel how cluster distance affects density, and click any cluster to zoom in.
Where to Take This Next
Clustering is the entry point to a much larger world of spatial aggregation techniques. Once you’re comfortable with this pattern, here are two directions worth exploring:
When your clustering needs go beyond “points near each other” and into actual partitioning of geographic regions, automated polygon splitting using Voronoi diagrams and clustering shows how to combine k-means with computational geometry to carve up large polygons into balanced sub-regions.
For analytical clustering on real-world datasets where points can belong partially to multiple groups — think traffic incidents, customer behavior, or environmental sensor readings — the fuzzy c-means clustering walkthrough on London accident data is a great next step.
Performance Recap
The reason this map handles 100,000 points without freezing comes down to four disciplined choices: building the feature array once and passing it to the source constructor, projecting coordinates at creation time rather than render time, caching style objects by visual bucket, and leaving updateWhileAnimating off. Skip any one of these and the same code will struggle at a fraction of the dataset size. Apply all four and the same pattern scales comfortably to half a million features on capable hardware.
Happy mapping!
I hope this tutorial will create a good foundation for you. If you want tutorials on another GIS topic or you have any queries, please send an mail at contact@spatial-dev.guru.